
Custom Sample - Zero2Auto
This Custom Sample 1 will be divided into several phases, each designed to demonstrate key concepts and techniques used for code obfuscation and evasion of analysis. Throughout these phases, we will explain the step-by-step process of implementing various obfuscation strategies aimed at protecting the integrity of the code while making it harder to reverse-engineer or analyze. Additionally, we will cover the different methods used to avoid detection and analysis by automated systems, showcasing how these techniques are employed to ensure security and confidentiality. Each phase will provide a deeper understanding of the tools and approaches used in the creation of robust, secure systems. Since the functions used to retrieve those names were heavily obfuscated, making it difficult to obtain the names statically, I used x32dbg to capture the return values of those functions.
I will be using x32dbg and ida for disassembling and debugging the sample.
First Stage
Firstly, I opened the sample main_bin.exe.bin (this was done to avoid directly opening the executable file and modifying extension).
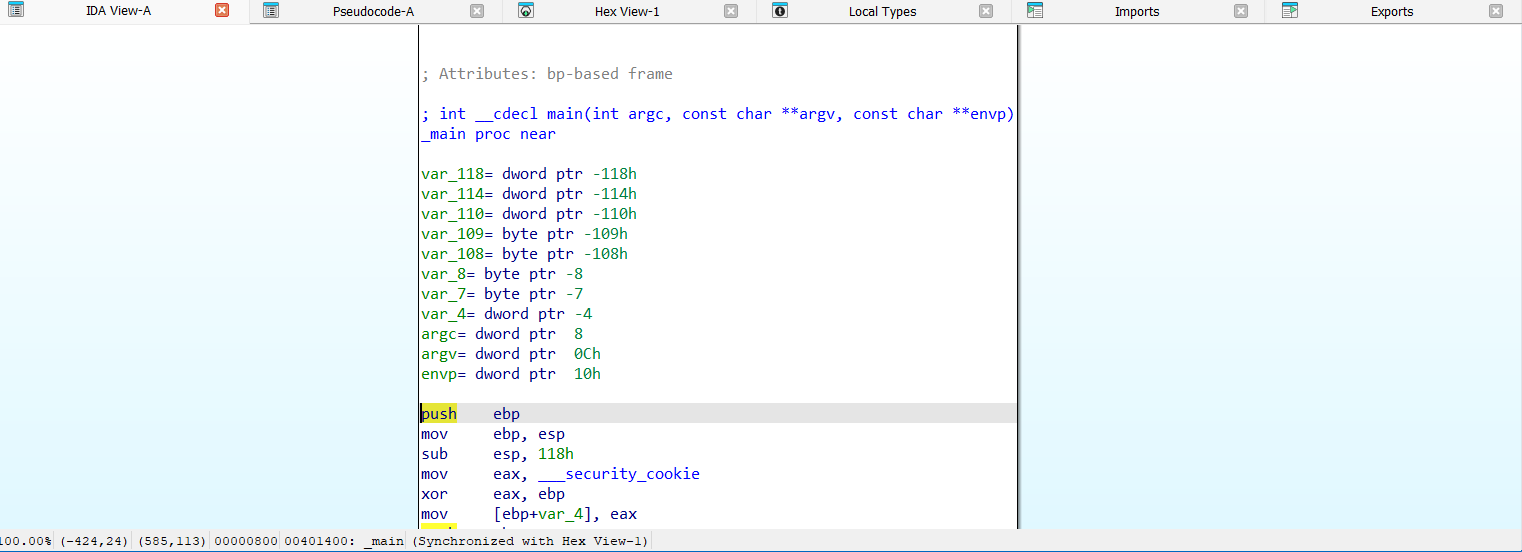
As soon as I decompiled the code, I noticed that at the beginning, there was a function passing the DLL to LoadLibrary. Additionally, I observed another function that retrieved the name of a function to obtain a pointer using GetProcAddress, and then proceeded with further operations.
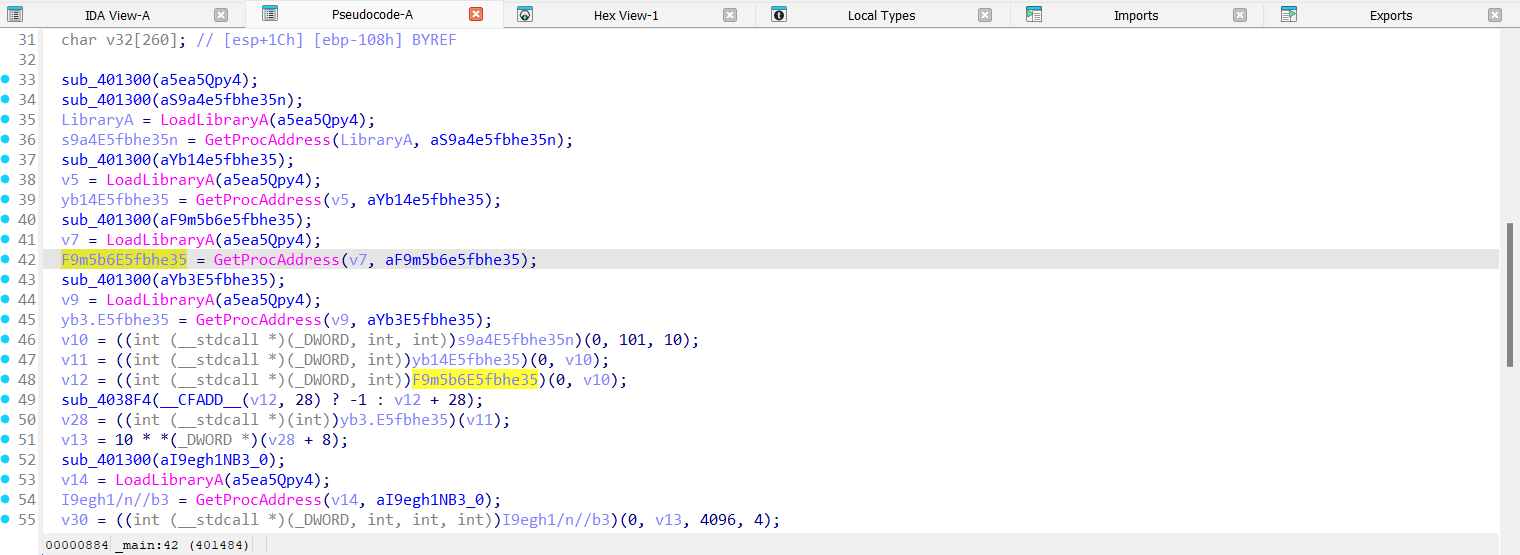
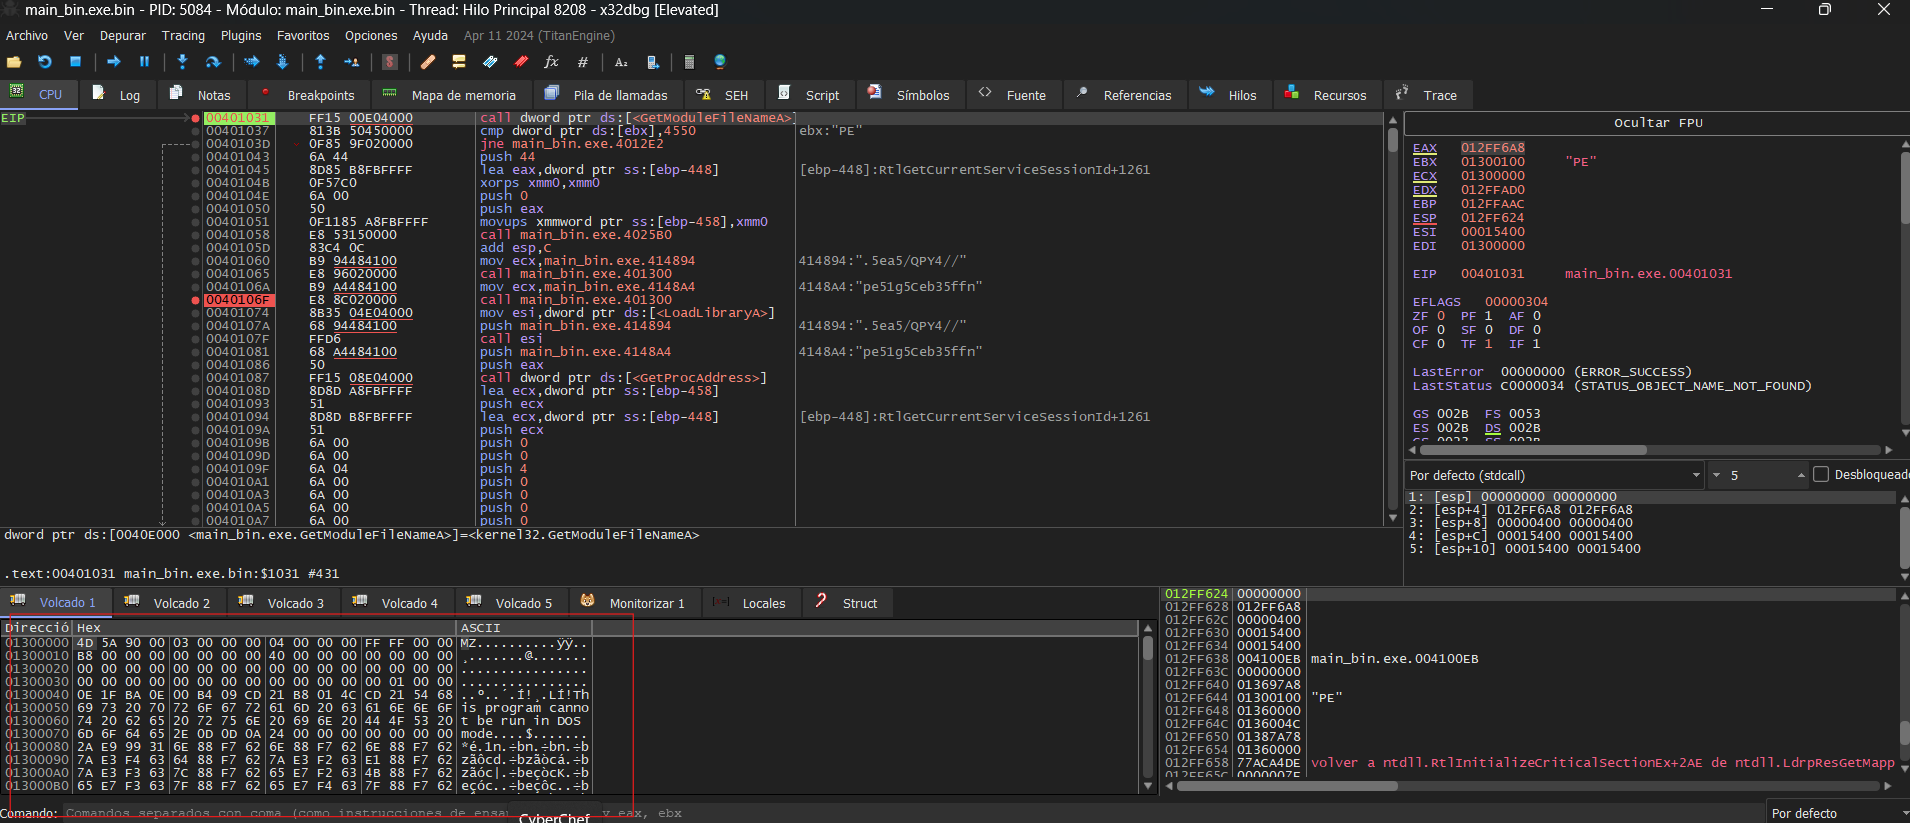
Since the functions used to retrieve those names were heavily obfuscated, making it difficult to obtain the names statically, I used x32dbg to capture the return values of the function sub_401300.
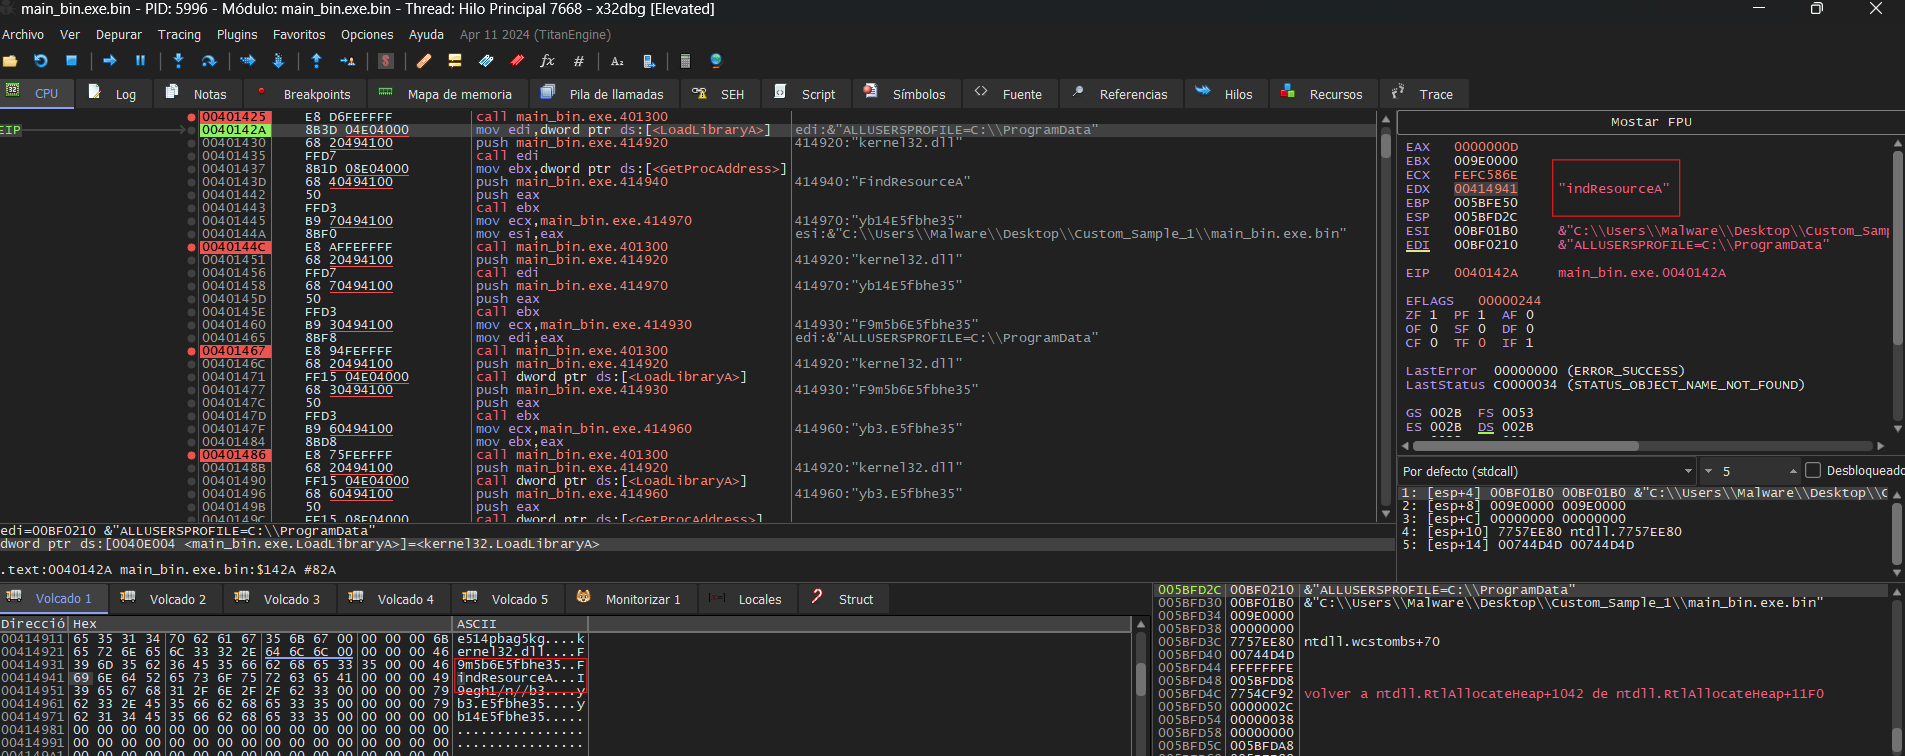
Important: To copy the addresses from IDA to x32dbg, I disabled ASLR, as the addresses would be different otherwise.
In the example above, you can see the result returned by the function in one of the cases. However, the results returned by the functions were as follows:
- FindResourceA
- LoadResource
- SizeofResource
- LockResource
- VirtualAlloc
Once I spotted the FindResourceA function, I proceeded to PEStudio to examine the resources of the sample. I found one resource, but it appeared to be empty; it might be encrypted. To confirm if this was the resource being loaded, I checked the parameters on the stack when FindResourceA was called, and they matched.
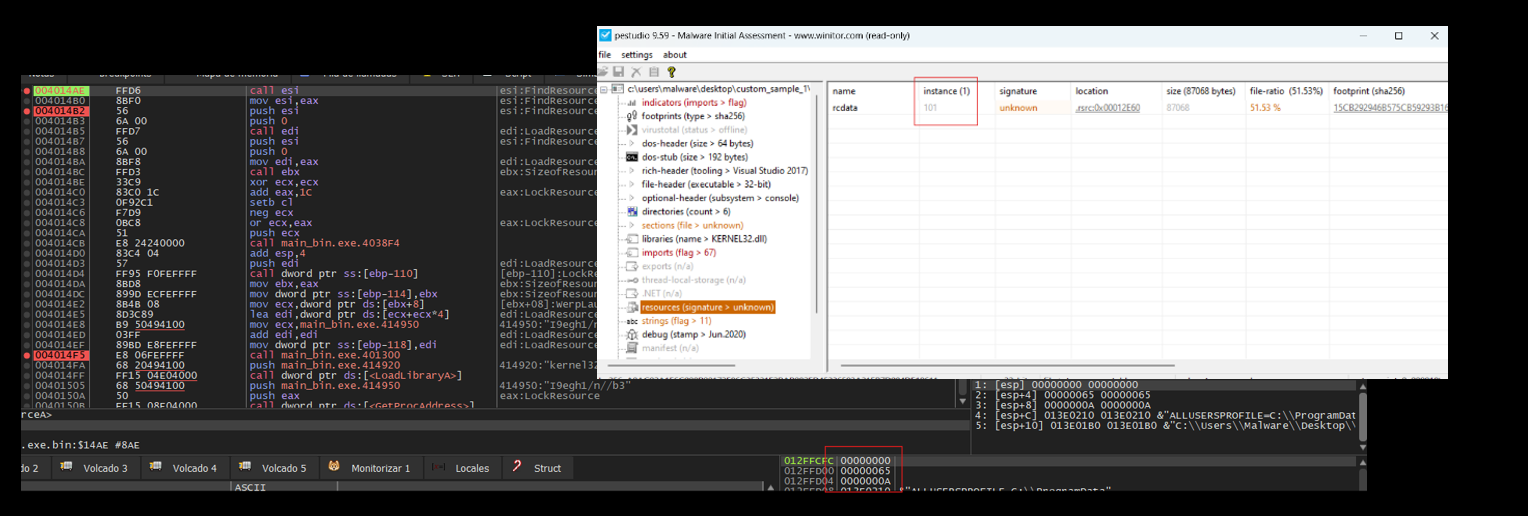
Important: 0x65 is 101 in decimal.
After retrieving the resource information, it uses an RC4 algorithm to decrypt the code stored within the resource.
Then, using the same technique to conceal Windows API calls, the following APIs were identified in the following order:
- CreateProcessA
- VirtualAlloc
- GetThreadContext
- ReadProcessMemory
- WriteProcessMemory
- VirtualAllocEx
- SetThreadContext
- ResumeThread
By analyzing the order of the functions, I suspected that the decrypted payload was being written into the opened process—the same one I had previously examined. I identified the memory region where the data would be stored using the first VirtualAlloc and then continued the execution. This allowed me to observe the decrypted content.
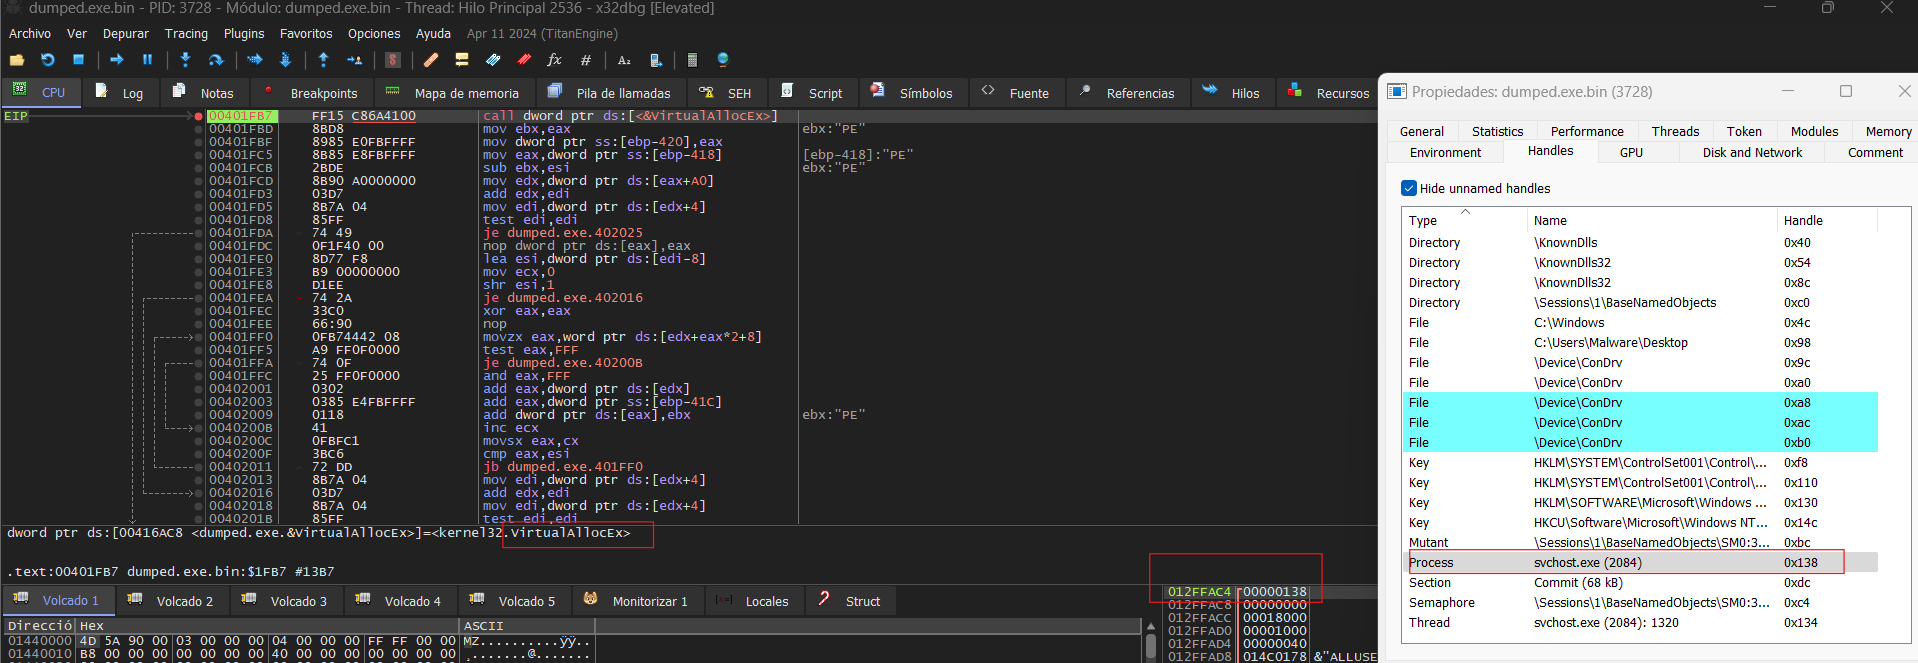
I dumped the memory section where the payload was implanted with System Informer and began analyzing it.
Second Stage
In the second stage, I noticed that the code was more heavily obfuscated. To analyze it further, I set breakpoints on key functions within the main subroutine to inspect their return values, suspecting the use of API hashing for function resolution.
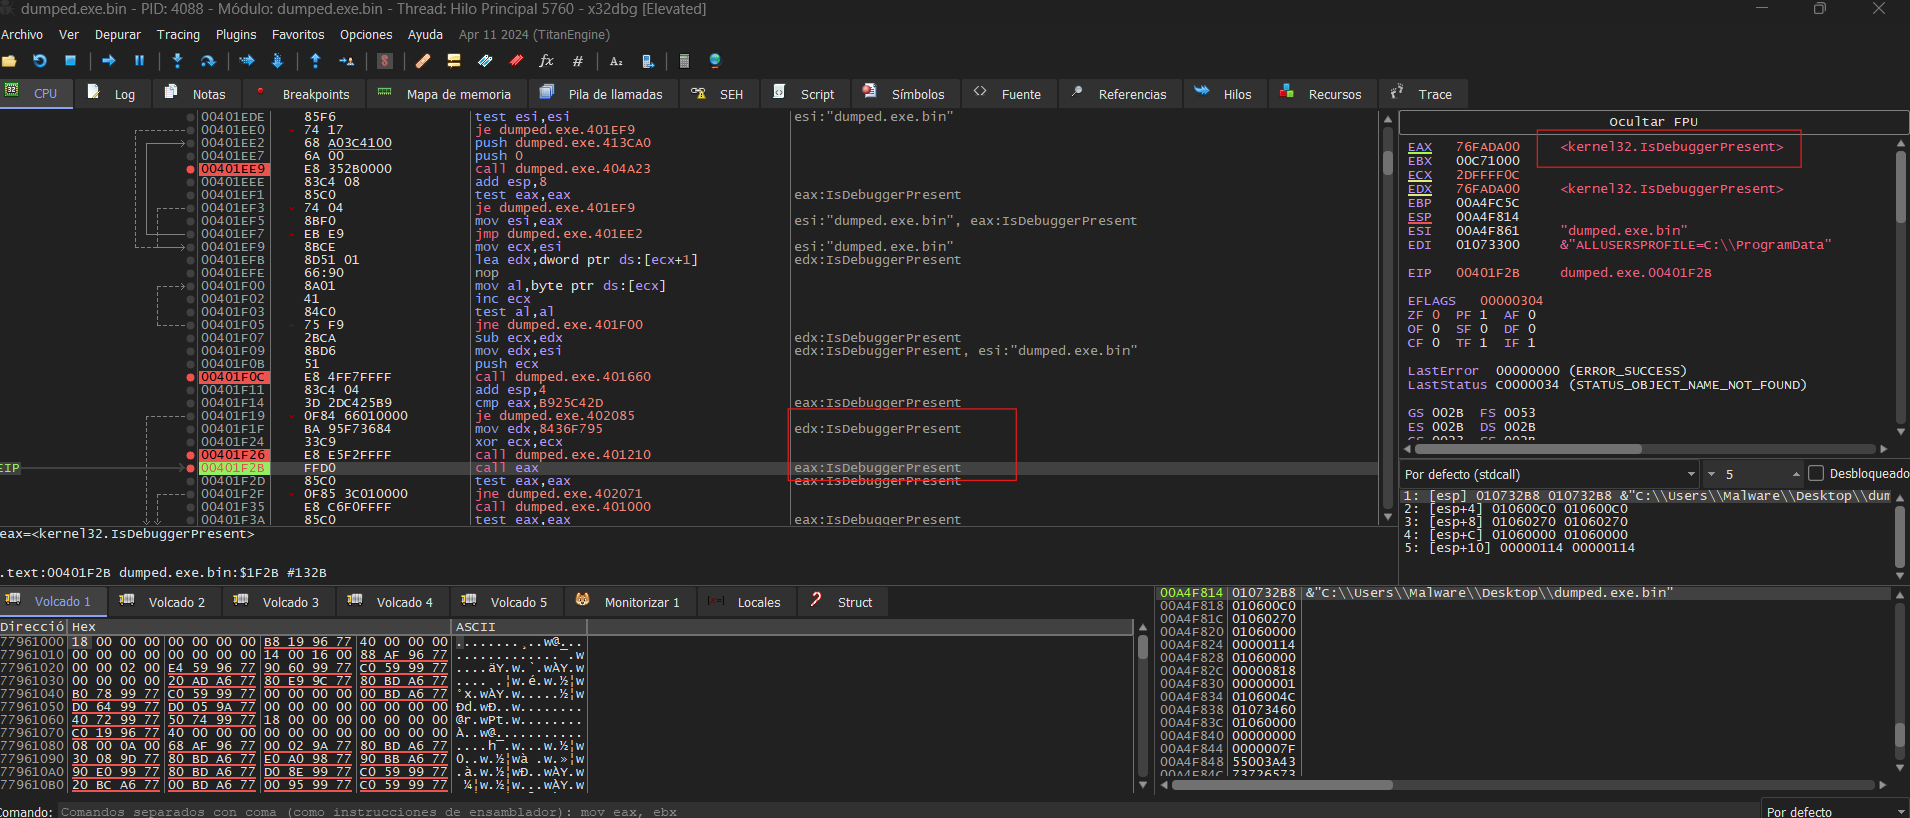
As observed above, we identified an anti-debugging technique using IsDebuggerPresent a Windows API that retrieves information from the PEB to detect the presence of a debugger. However, the call to IsDebuggerPresent was obfuscated using API hashing, making static analysis more difficult. While analyzing the pseudocode, I found another function implementing additional anti-analysis techniques. To bypass this, I modified the return value of IsDebuggerPresentand sub_401000 by setting EAX to 0.
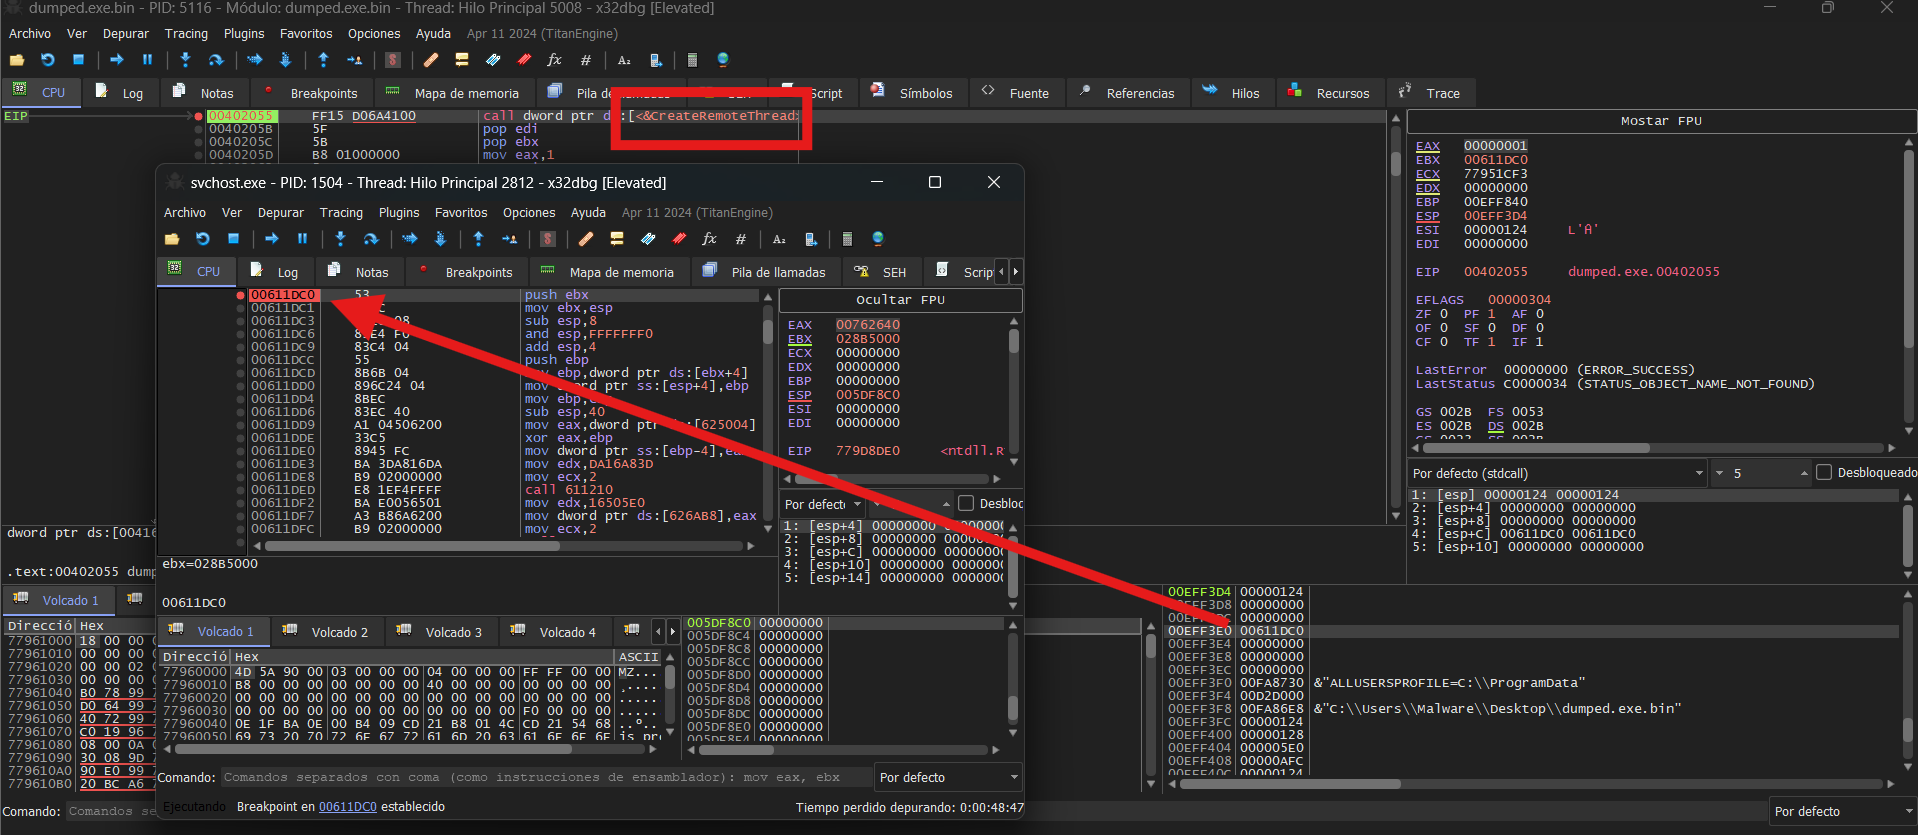
At a certain point while analyzing the pointers, I noticed that svchost.exe was being attached to our process. This prompted me to investigate the functions more thoroughly. During my examination, I identified the creation of the svchost.exe process, suggesting potential process injection or manipulation.
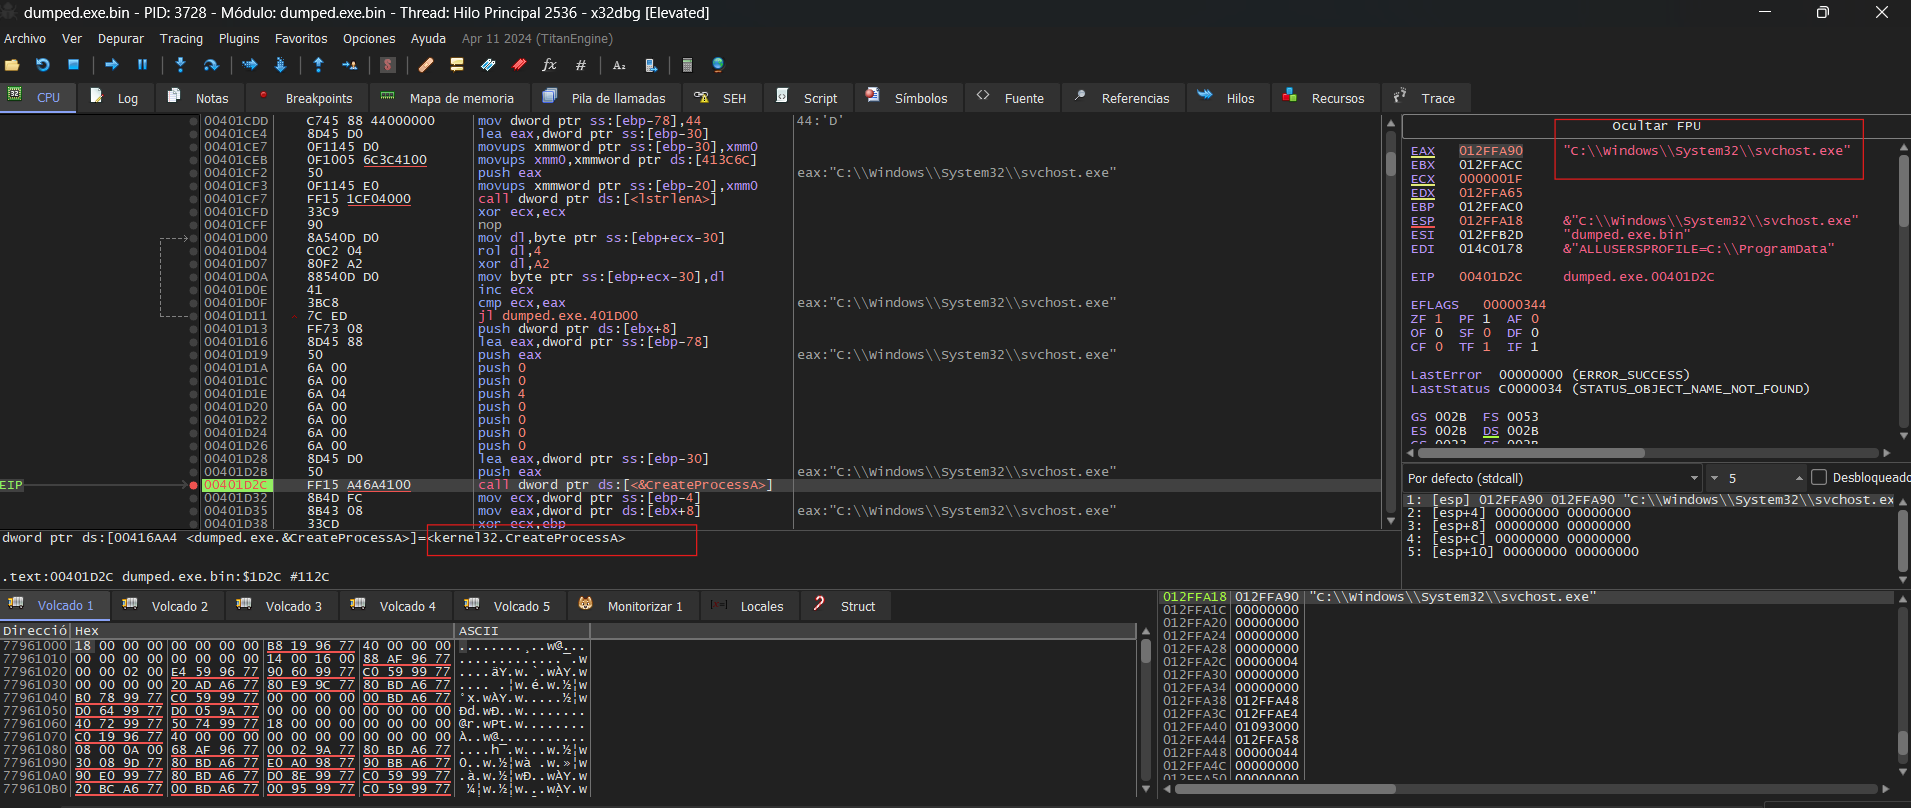
Once the process was created, it allocated a region of memory to store a new executable within itself. However, this wasn’t what caught my attention—it was the interaction with svchost.exe. When I identified a VirtualAllocEx call allocating memory in that process, I confirmed it was svchost.exe by analyzing the handle.
To verify my hypothesis, I attached the process to x32dbg and set a breakpoint on the allocated memory region. I also attempted to dump the newly allocated memory, but since static analysis wasn’t feasible, I proceeded with dynamic analysis instead.
Following this, I anticipated a WriteProcessMemory call. If I couldn’t find it, I planned to look for a ResumeThread or simply wait until the memory region was populated. Eventually, one of my breakpoints hit WriteProcessMemory and CreateRemoteThread, and I continued executing within svchost.exe.
Third Stage
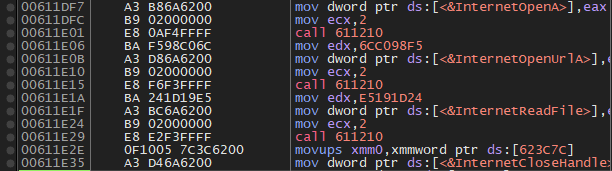
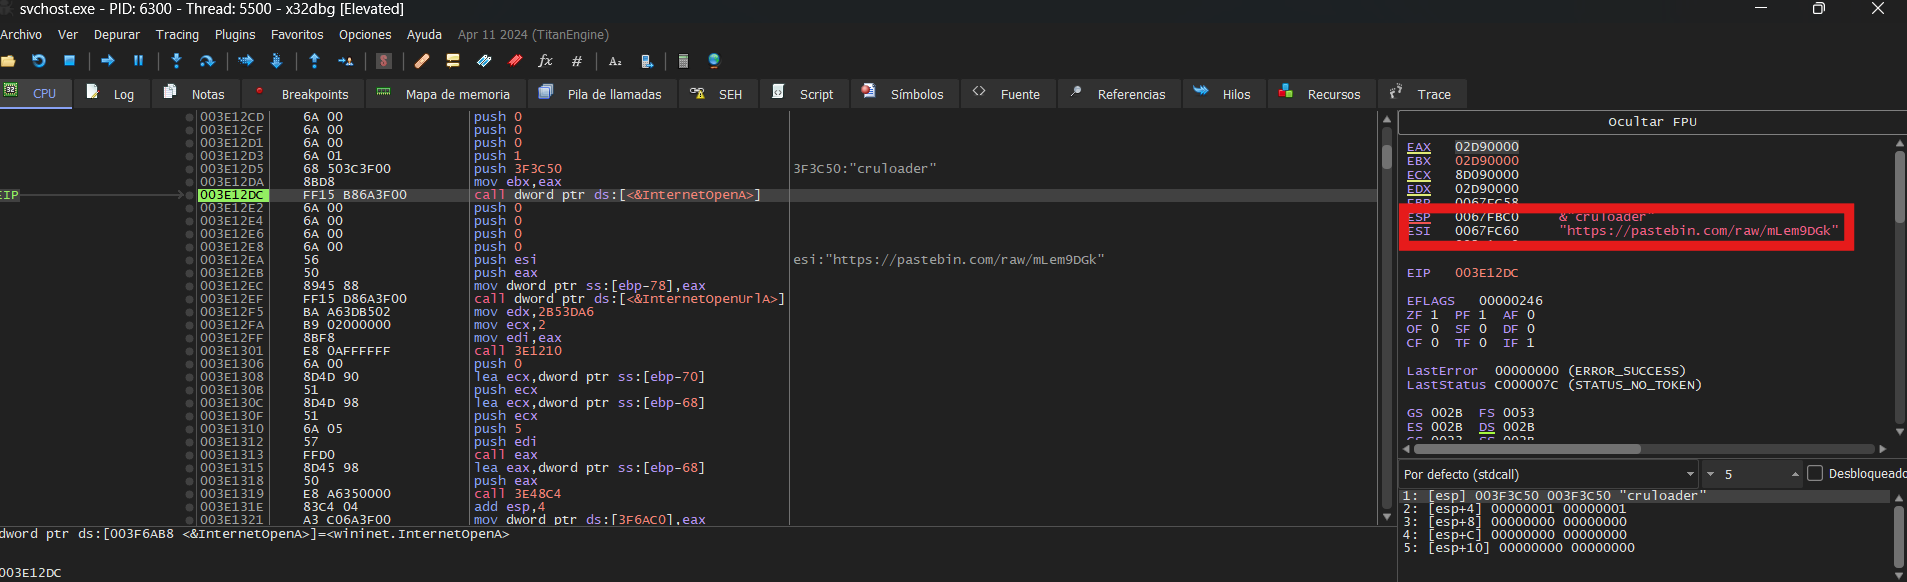
After analyzing the payload dynamically, I discovered obfuscated functions from WININET.DLL. To gather IoCs, I examined the contacted URL and the User-Agent used.
Here we have the User-Agent and the URL visited:
- User-Agent: cruloader
- URL: https://pastebin[.]com/raw/mLem9DGk
And the URL accessed was: